
MERCURIUS™ DRUG-seq is a rapid, cost-effective, RNA-extraction-free bulk 3’ mRNA-seq method. It provides ultra-high-throughput studies, such as drug discovery and toxicogenomic screens, with unbiased, transcriptome-wide gene expression data for hundreds of compounds or experimental conditions simultaneously. Featuring early sample barcoding technology, MERCURIUS™ DRUG-seq kits enable a single next-generation sequencing (NGS) lab technician to generate sequencing libraries from up to 5000-10’000 cells per well in 384 plates in less than two days without relying on any devoted automation. MERCURIUS™ DRUG-seq delivers accurate and reproducible transcriptomic read-outs for typically over 16,000 genes at a sequencing depth of one million reads per sample.
Arguably, one of the most informative pieces of information and sources of variation in drug screening pipelines is cell viability after treatment. This information is valuable as it can inform researchers whether a compound has a cytotoxic effect or, conversely, induces cell proliferation. When combined with gene expression data, cell viability can be a crucial indicator to determine whether low signal in the samples is due to cell death from compound toxicity or simply a result of technical variations, such as those arising from cell culturing or sample handling. However, in most MERCURIUS™ DRUG-seq experiments, cell viability data is unavailable, making it challenging to disentangle technical variations from biases caused by varying cell numbers.
In this article, we demonstrate how ultra-high-throughput compound screening can utilize MERCURIUS™ DRUG-seq to generate valuable transcriptomic readouts and infer cellular responses to various drugs, compound concentrations, or experimental conditions and how incorporating External RNA Controls Consortium (ERCC) spike-in RNAs at the cell lysis stage can provide additional meaningful information. We will study how ERCC can be employed for quality control purposes, linking variations in ERCC counts to technical factors such as differences in lysis buffer volume, cell mixture transfer, sample pooling, or cell lysis. Ultimately, we will explore how ERCC molecules can serve as a proxy for estimating cell viability and thus potentially alleviate the need to perform time-consuming cell viability assays.
What are ERCC spike-in RNAs?
ERCCs are synthetic mRNA molecules of variable sizes that mimic cellular mRNAs. They are commonly added to RNA-sequencing experiments after sample isolation and are known as ‘spike-ins.’ ERCCs are used as quality assurance tools to support reproducible gene expression measurements and to address technical sources of variability (Jiang et al., 2011).
In MERCURIUS™ DRUG-seq, ERCC spike-in RNAs can be mixed with the cell lysis buffer and added to each well in identical amounts. With such uniform distribution, ERCC counts are expected to be consistent across all wells of a plate upon data analysis. Any variation in ERCC counts can be traced back to technical variations, such as the volume of lysis buffer added to each well, the volume of lysed cell mixture transferred to the reverse transcription reaction, the subsequent pooling of samples for library preparation, or differences in overall cell lysis. These technical variations also affect gene counts, which can be confused with biological variations related to the drug or compound treatment.
The MERCURIUS™ DRUG-seq Pipeline incorporating ERCC molecules
MERCURIUS™ DRUG-seq is optimized for RNA-seq library preparation from up to 384 samples while bypassing RNA extraction. It relies on the initial seeding of a uniform number of between 5,000 and 10,000 cells per well of a 384-well plate, treatment of each well with compounds or drug concentrations of interest, followed by cellular lysis, barcoding, and library preparation (Fig. 1).
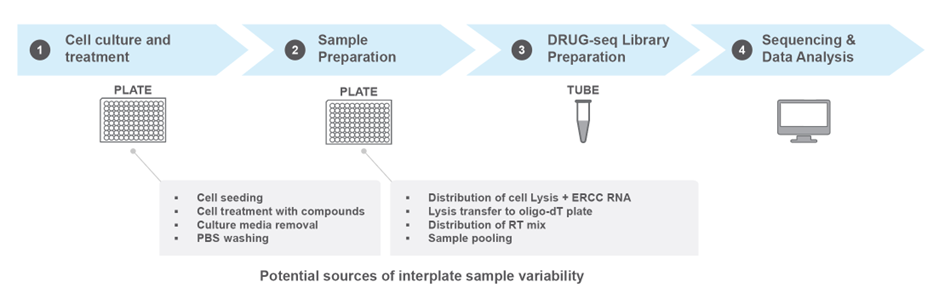
Figure 1. A typical MERCURIUS™ DRUG-seq workflow indicating steps potentially introducing inter-sample technical variation. A uniform number of cells is seeded at the start of the workflow, but the number of cells may differ at the sample preparation stage due to cytotoxicity or various technical variations. It’s also possible that the sample performance variation is due to other technical fluctuations. Including ERCC spike-in RNA at the cell lysis stage helps users to reveal the cause of variation, whether it is due to cell number or library preparation variations.
However, while each sample generates accurate and comprehensive transcriptome-wide gene expression information, estimating cell viability in response to drug treatment using RNA expression alone is challenging. Variability in cell viability across wells can lead to significant differences in captured reads, introducing a bias correlated with drug or dose conditions. This bias, originating from the number of cells, can be intermingled with other technical variations, making it difficult to disentangle. By using ERCC molecules, one can better interrogate the data and exclude library preparation as a potential source of bias.
Using ERCC spike-in RNAs to Assess Technical Variations
Using ERCC counts, we can model the effect of technical variations. As the ‘ground-truth’ ERCC concentrations added at the lysis stage of library preparation are known, we can compare these values to ERCC molecule counts after data analysis to allow an evaluation of the precision of library preparation and sequencing. In this context, the correlation between observed ERCC counts (measured via DRUG-seq) and the ground truth ERCC concentration can be interpreted as a score indicative of library quality (Fig. 2A). By analyzing the percentage of reads per well across all wells in a MERCURIUS™ DRUG-seq plate, we can compute the percentage of reads per sample (Fig. 2B). This metric can be calculated based on the number of reads mapped to genes (exon mapping) and the number of reads mapped to ERCC molecules. In both cases, we expect an average of 1 divided by the number of multiplexed samples (here, 1 / 180, or 0.55% reads per sample). Interestingly, ERCC typically shows lower variability in the percentage of reads per sample, with values closer to the average. Because ERCC counts are only affected by library preparation-induced variability, but gene counts are influenced by both library preparation-induced and biologically-induced variability, we can attribute any differences in variability to biologically meaningful factors.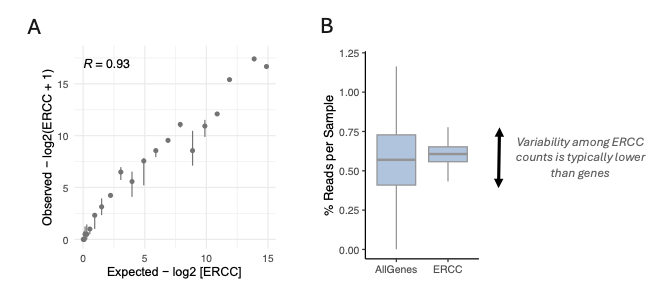
Figure 2. ERCC molecules’ readout. (A) The RNA-sequenced ERCC molecules (y-axis) can be compared with the ground truth concentration added in each well (x-axis), represented as a scatter plot. (B) Percentage of reads per well for all reads mapped to genes (exon mapping) or with all reads mapped to ERCC molecules.
ERCC as a Control to Assess Technical Variability in MERCURIUS™ DRUG-seq Experiments
To study the use of ERCC in more detail, we present a 384-well DRUG-seq plate treated with DMSO. The plate is in optimal conditions, with even numbers of mapped reads across all wells and no apparent bias. Ideally, reads should be demultiplexed with equal probability across all 384 wells, resulting in a probability of 1/384 (p=0.0026). Consequently, we expect 0.26% of reads in each well after demultiplexing. In our case, the plate demonstrated an even distribution of total mapped reads (Fig. 3A) and ERCC molecules (Fig. 3B), both with a demultiplexing percentage close to the expected 0.26%. Overall, both ERCC and total read counts show no row or column biases and are centered around the expected 0.26% (Fig. 3C).
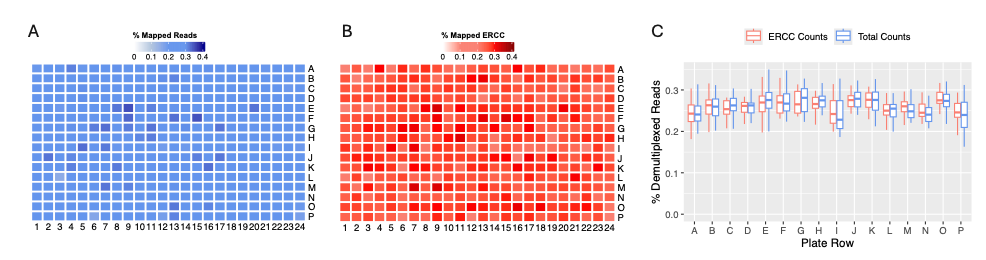
Figure 3. MERCURIUS™ DRUG-seq control plate. (A) Percentage of mapped reads, considering all mapped counts, displayed in a plate view from a 384-well MERCURIUS™ DRUG-seq plate. (B) Percentage of mapped reads to ERCCs. (C) Percentage of demultiplexed reads, considering all reads (blue) or only ERCCs (red), when normalizing the demultiplexing rate.
The Role of ERCC Molecules in Assessing Technical versus Biological Variability
To demonstrate the practical utility of ERCC, we examined 180 samples arranged in partially filled 384-well MERCURIUS™ DRUG-seq plates. In this experiment, six independent plates with various drug treatments exhibited a recurrent and strong row-associated bias. Specifically, the middle rows showed significantly lower read depth in a clear spatial pattern (Fig. 4A), which could not be attributed to the cytotoxicity of the compounds—a hypothesis we rejected based on the arrangement of drugs and doses. This suggested that the issue might be with the starting RNA material or a problem induced during library preparation. Thanks to ERCC, we confirmed that the ERCC demultiplexing was evenly distributed as expected (Fig. 4B-C), allowing us to rule out a library preparation-induced bias.
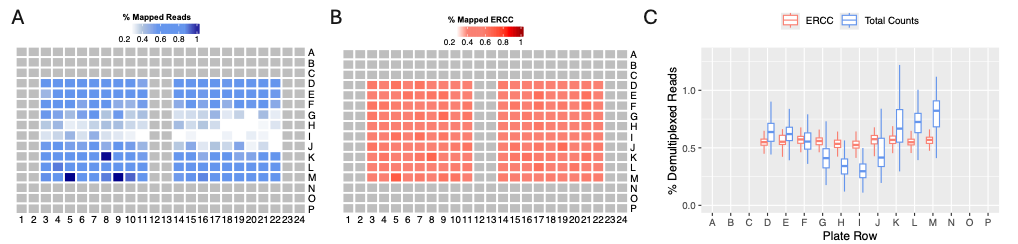
Figure 4. MERCURIUS™ DRUG-seq with row-associated bias. (A) Percentage of mapped reads, considering all mapped counts, displayed in a plate view from a partially filled 384-well DRUG-seq plate containing 180 samples. (B) Percentage of reads mapped to ERCCs. (C) Percentage of demultiplexed reads, considering all mapped reads (blue) or only ERCCs (red), when normalizing the demultiplexing rate.
ERCC Analysis Reveals Variation in Cell Numbers
We next investigated the relationship between ERCC counts and the number of cells added to MERCURIUS™ DRUG-seq plates. We found that as more cells are plated per well, the percentage of ERCC relative to the total number of mapped reads per sample decreases (Fig. 5A). Consequently, we developed a new metric, % ERCC / Mapped Reads, to estimate the number of cells per well. In our biased plates shown in Fig. 4, the middle rows appeared depleted in mapped reads, increasing the % ERCC / Mapped Reads value (Fig. 5B-C), suggesting fewer cells were present in these middle rows.
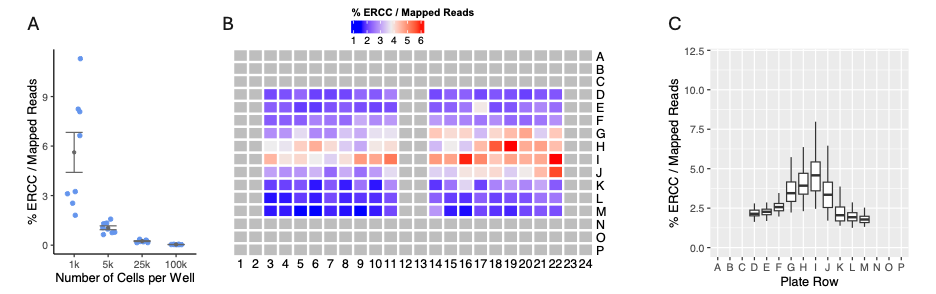
Figure 5. Percentage of ERCC reads correlates with cell number. (A) The percentage of ERCC reads against total read counts was computed for each sample in multiple iterations of a MERCURIUS™ DRUG-seq experiment with varying numbers of cells added to the plate’s wells. (B) The percentage of ERCCs divided by the total read counts, displayed in a plate view from a partially filled 384-well MERCURIUS™ DRUG-seq plate containing 180 samples. (C) The percentage of ERCCs divided by the total read counts for each row in the plate.
Using ERCC Molecules to Provide Insights into Drug Cytotoxicity
Given the non-linear relationship between the % ERCC / Mapped Reads metric and the number of cells per well (Fig. 5A), we explored alternative representations. We identified that the logarithm of gene counts divided by ERCC counts is the best predictor of cell number, showing a remarkable Pearson’s correlation of 0.97 (Fig. 6A). Using this refined metric, we examined potential links with drug dosage under various conditions. Interestingly, some drugs appear to increase mRNA content, either through enhanced transcription or cell division, as drug dosage increases (Fig. 6B, Compounds 1 & 2). Conversely, other compounds seem to reduce mRNA levels, likely due to cell death and compound-induced cytotoxicity (Fig. 6B, Compound 3).
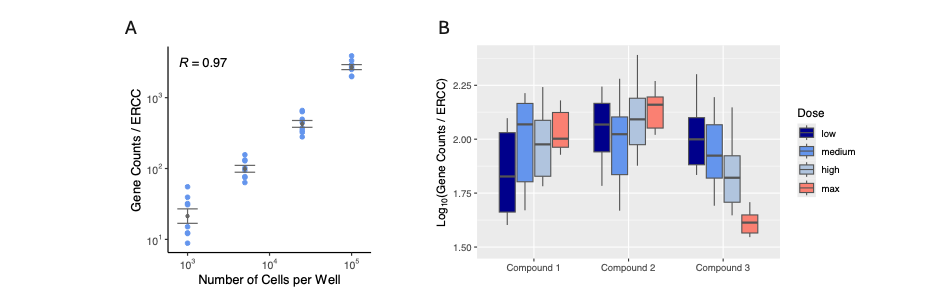
Figure 6. The logarithm of total gene counts divided by ERCC molecules is a strong predictor of cell numbers. (A) The total number of mapped reads to genes (exon mapping) divided by the number of ERCC molecules was calculated for each sample (y-axis) across multiple iterations of a MERCURIUS™ DRUG-seq experiment with varying numbers of cells added to the plate’s wells. This metric is displayed on a scatter plot with a logarithmic scale and compared to the absolute number of cells per well (x-axis). (B) The logarithm of the total number of mapped reads to genes (exon mapping) divided by the number of ERCC molecules is shown for twelve different drug and dose conditions, covering three compounds and four doses.
Conclusions
In this blog, we explored how ERCC can be used for quality control purposes and to gain insights into the biology behind a MERCURIUS™ DRUG-seq experiment. From a quality control perspective, ERCC serves as a reliable reference molecule, allowing us to assess the accuracy and reproducibility of any MERCURIUS™ DRUG-seq experiment, from sequencing to library preparation. By comparing ERCC counts with gene count variability, we can estimate library preparation-induced variability, ensuring that our experimental results are consistent and trustworthy.
In cases of unexplained biases, such as the strong row-associated bias in sequencing depth shown in Fig. 3, ERCC proves to be an excellent tool for identifying the source of the bias. It helps exclude library preparation as a source of unwanted biases, saving time and resources in finding the true cause of variation. This capability is crucial for ensuring that any observed effects are genuinely biological rather than technical artifacts.
Additionally, we discovered that ERCC molecules can help infer the number of cells present in DRUG-seq plate wells. This information is valuable for understanding drug responses, providing clues about cell death, compound-induced cytotoxicity, or transcriptional bursts due to treatment. By analyzing the proportion of ERCC molecules relative to total mapped reads, we can estimate cell numbers and gain insights into how different compounds affect cellular behavior.
In conclusion, using ERCC molecules enhances both the quality control and biological interpretation of DRUG-seq experiments. Its ability to provide reliable reference data and insights into cellular responses makes it an essential component of our experimental toolkit, ensuring that our results are both accurate and meaningful.
References
- Jiang, L., Schlesinger, F., Davis, C.A., Zhang, Y., Li, R., Salit, M., Gingeras, T.R. and Oliver, B., 2011. Synthetic spike-in standards for RNA-seq experiments. Genome research, 21(9), pp.1543-1551.